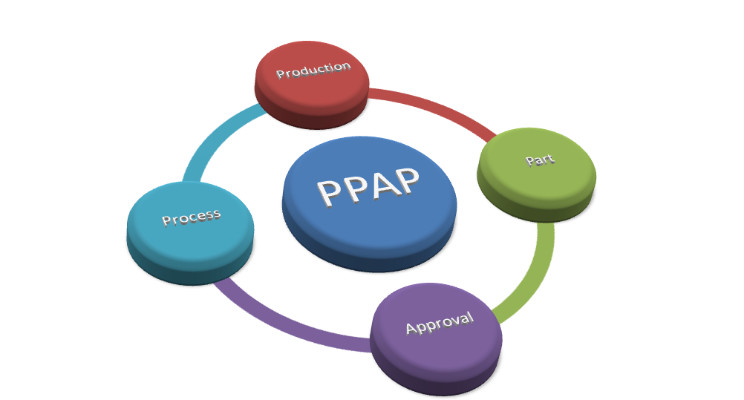
* Production Part Approval Process :-
1.0) Introduction of Production Part Approval Process (PPAP)
2.0) What is Production Part Approval Process (PPAP)
3.0) Why perform Production Part Approval Process (PPAP)
4.0) When to perform Production Part Approval Process (PPAP)
5.0) How to perform Production Part Approval Process (PPAP)
1.0) Introduction of Production Part Approval Process (PPAP).
Production Part Approval Process (PPAP) is a valuable tool for establishing confidence in component suppliers and their production processes. In today’s competitive manufacturing environment controlling cost and maintaining a high level of quality have become vital to a company’s success. Increasing costs of equipment, materials and labor combined with expanding world markets have resulted in an increase of outsourced parts. Many component parts are being outsourced to overseas manufacturers. This often results in longer lead times and larger order quantities. Therefore it has become imperative to provide quality parts that meet the customer’s requirements the first time and every time. Initially PPAP was utilized by the automotive and aerospace industries. PPAP is now being utilized by several industries to improve communication and provide quality products. Within the automotive industry the ultimate resource for PPAP information is the manual published by the Automotive Industry Action Group (AIAG).
2.0) What is Production Part Approval Process (PPAP)
PPAP defines the approval process for new or revised parts, or parts produced from new or significantly revised production methods. The PPAP process consists of 18 elements that may be required for approval of production level parts. Not all of the elements are required for every submission. There are five generally accepted PPAP submission levels. The PPAP manual contains detailed information, guidelines and sample documents useful for completing the process requirements. The resulting PPAP submission provides the evidence that the supplier has met or exceeded the customer’s requirements and the process is capable of consistently reproducing quality parts.
3.0) Why perform Production Part Approval Process (PPAP)
The PPAP process verifies that the supplier understands all customer engineering design specifications and requirements and that the process is capable of consistently producing product meeting those requirements during an actual production run at the quoted production rate. PPAP and other quality tools continue to be implemented into more industries; therefore it is important to gain an understanding of the PPAP requirements to remain competitive as a parts supplier.
4.0) When to perform Production Part Approval Process (PPAP)
A PPAP is required for any new part submission as well as for approval of any change to an existing part or process. The customer may request a PPAP at any time during the product life. This demands that the supplier must maintain a quality system that develops and documents all of the requirements of a PPAP submission at any time.
5.0) How to perform Production Part Approval Process (PPAP)
The process of completing a PPAP submission is fairly complex. This detailed process is a collection of key elements that must be completed to verify that the production process will produce a quality product. Not all of the elements are always required for a PPAP submission. The particular requirements of the PPAP are usually negotiated during the quoting process.
* Elements of Production Part Approval Process (PPAP) :-
Below is the list of all 17 elements accompanied by a brief description for each element.
1.0) Design Documentation
2.0) Engineering Change Documentation
3.0) Customer Engineering Approval
4.0) Design Failure Mode and Effects Analysis
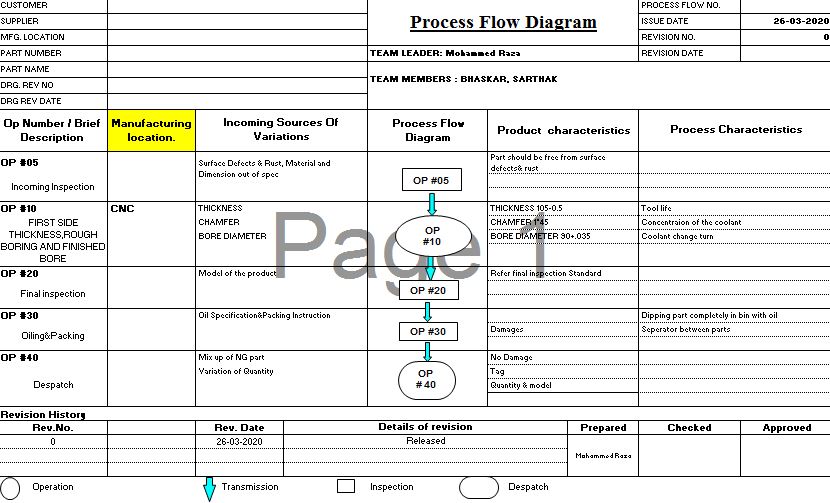
5.0) Process Flow Diagram
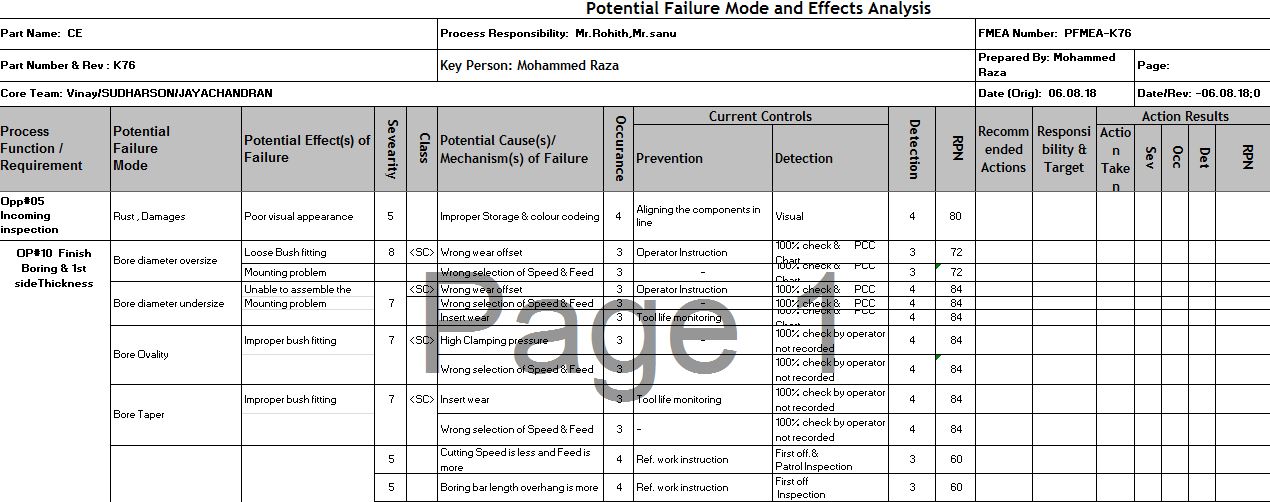
6.0) Process Failure Mode and Effects Analysis
7.0) Control Plan
8.0) Layout Inspection Report - PPAP
9.0) Material Performance test Reports
10.0) Initial Process Capability Study
11.0) Measurement System Analysis Studies
12.0) Qualified Laboratory Documentation - Scope of NABL
13.0) Appearance Approval Report
14.0) Checking Aids
15.0) Master Sample
16.0) Packaging standards and specifications
17.0) Part Submission Warrant (PSW)
1.0) Design Documentation
A printed copy of drawing needs to be provided. If the customer is responsible for designing, this is a copy of customer drawing that is sent together with the Purchase Order (PO). If supplier is responsible for designing this is a released drawing in supplier's release system. "Each and every feature must be "ballooned" or “road mapped” to correspond with the inspection results (including print notes, standard tolerance notes and specifications, and anything else relevant to the design of the part).
2.0) Engineering Change Documentation
If the PPAP is being required due to a request for a change to a part or product, the documentation requesting and approving the change must be included in the PPAP package. This documentation usually consists of a copy of the Engineering Change Notice (ECN), which must be approved by the customer engineering department.
3.0) Customer Engineering Approval
When required as part of the PPAP, the supplier must provide evidence of approval by the customer engineering department.
- If required, pre-PPAP samples are ordered by the customer for onsite testing. The samples must be production intent and ship with a waiver so that testing can be done. When testing is complete, the test engineers will provide an approval form for inclusion in the PPAP submission.
- Note: A copy of a “Temporary Deviation” is normally required to submit parts to the customer prior to a PPAP approval.
4.0) Design Failure Mode and Effects Analysis
A copy of the Design Failure Mode and Effect Analysis (DFMEA), reviewed and signed-off by supplier and customer. If customer is design responsible, usually customer may not share this document with the supplier. However, the list of all critical or high impact product characteristics should be shared with the supplier, so they can be addressed on the PFMEA and Control Plan
5.0) Process Flow Diagram
The Process Flow Diagram outlines the entire process for assembling the component or final assembly in a graphical manner. The process flow includes incoming material, assembly, test, rework and shipping.
A copy of the Process Failure Mode and Effect Analysis (PFMEA), reviewed and signed-off by supplier and customer. The PFMEA follows the Process Flow steps, and indicates "what could go wrong" during the fabrication and assembly of each component.
7.0) Control Plan
The Control Plan is an output from the PFMEA. The Control Plan lists all product Special Characteristics and inspection methods required to deliver products that continually

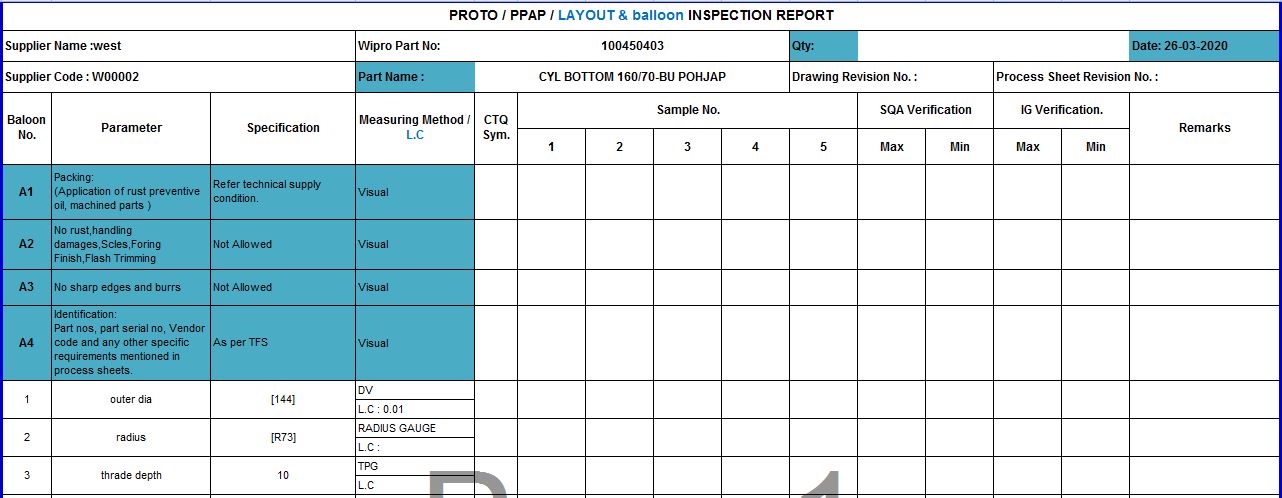
8.0) Layout Inspection Report - PPAP
A list of every dimension noted on the ballooned drawing. This list shows the product characteristic, specification, the measurement results and the assessment showing if this dimension is "ok" or "not ok". Usually a minimum of 6 pieces is reported per product / process combination.
9.0) Material Performance test Reports
- This element should contain a copy of the Design Verification Plan and Report (DVP&R). The DVP&R is a summary of every validation test performed on the part. It should list each and every test performed, a description of how the test was performed, and the results of each test.
- This section may also include copies of all the certification documents for all materials (steel, plastics, etc.) listed on the prints. The material certification shall show compliance to the specific call on the print.
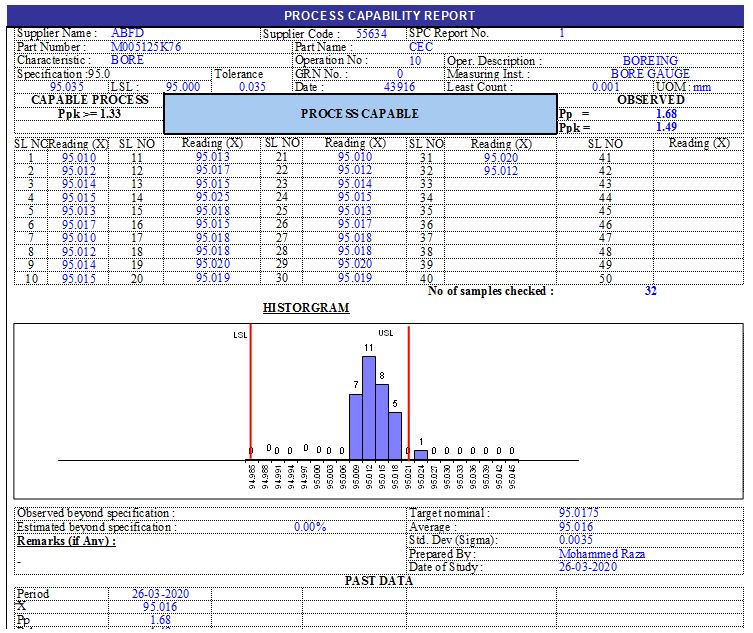
10.0) Initial Process Capability Study
Initial process studies will be done on all the production processes and will include Statistical Process Control (SPC) charts on the critical characteristics of the product. These studies demonstrate that the critical processes are stable, demonstrate normal variation and are running near the intended nominal value.
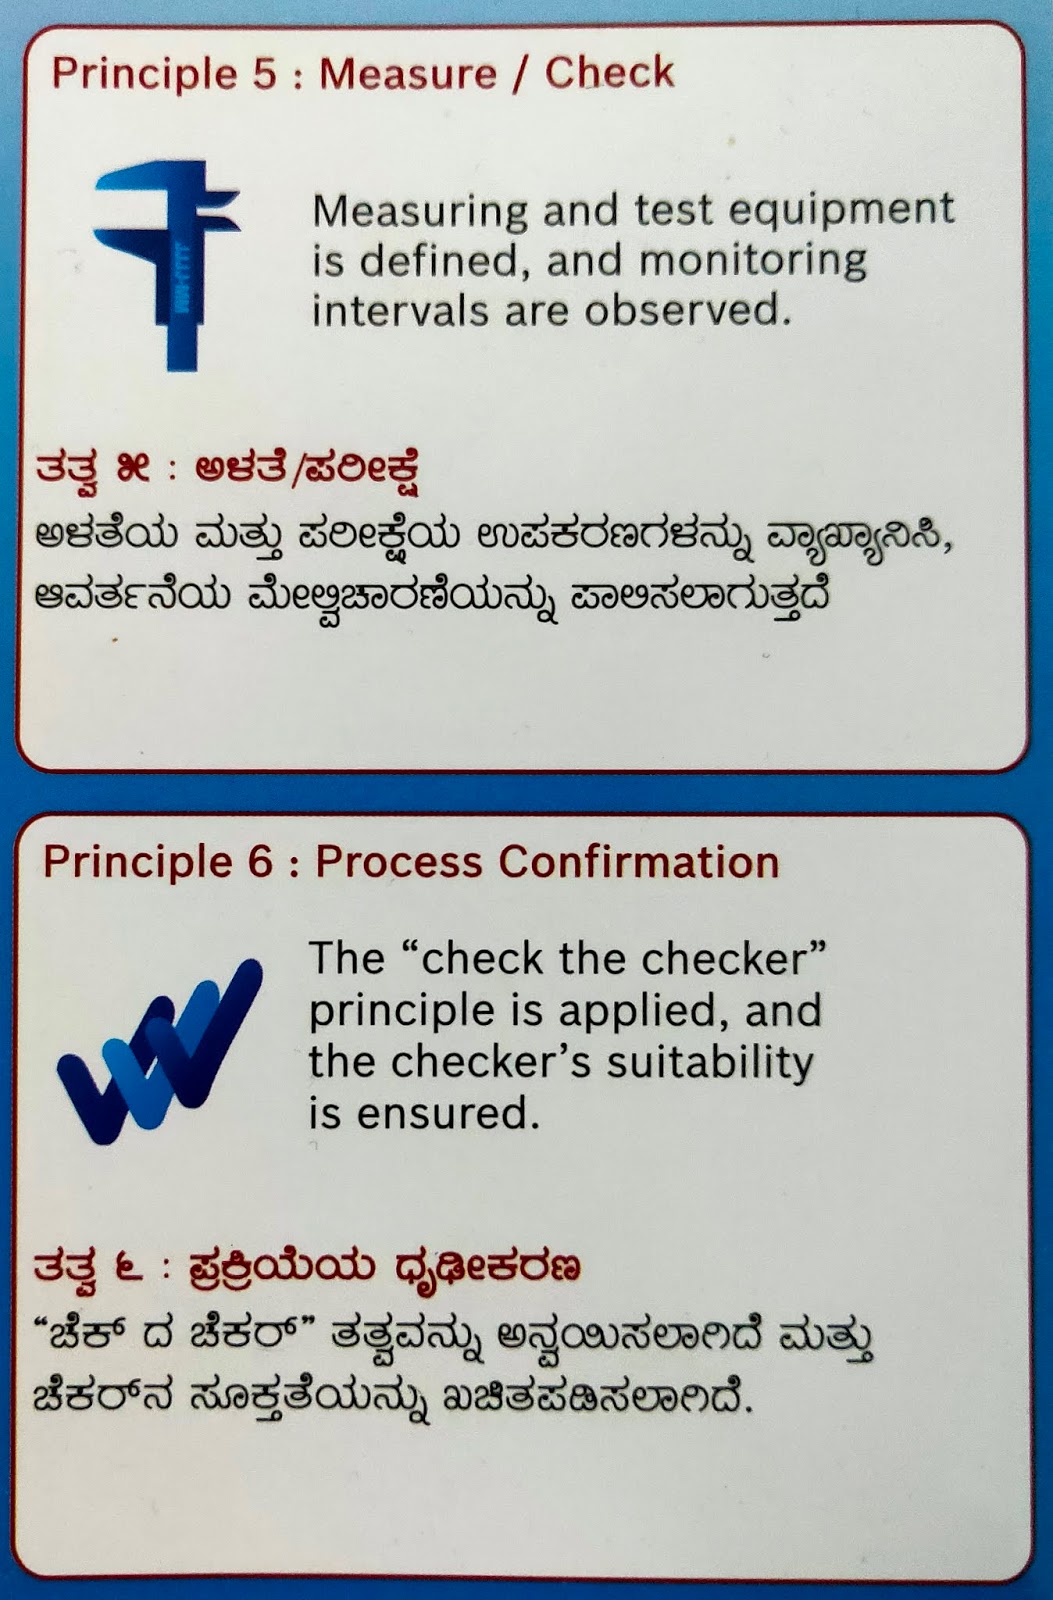
11.0) Measurement System Analysis Studies
Measurement System Analysis deals with analyzing the effect of the Measurement System on the measured value.It emphasis on the effect due to Equipment and personnel (Appraiser).We test the Measurement System to determine numerical values of its statistical Properties and compare them to accepted standards.
> R&R below 10% & ndc - Greater than or Equal to 5 - Measurement System is Acceptable
> R&R between 10 to 30% - Measurement System can be Acceptable under concession, based on the cost of repair, importance on product Quality etc,.
> R&R greater than 30% - Not Acceptable, Measurement System Needs Improvement.
> R&R between 10 to 30% - Measurement System can be Acceptable under concession, based on the cost of repair, importance on product Quality etc,.
> R&R greater than 30% - Not Acceptable, Measurement System Needs Improvement.

12.0) Qualified Laboratory Documentation - Scope of NABL
Qualified laboratory documentation consists of the industry certifications for any lab that was
involved in completing validation testing.This could be for an in-house test lab or any offsite
contracted test facilities that were used for validation or material certification testing.
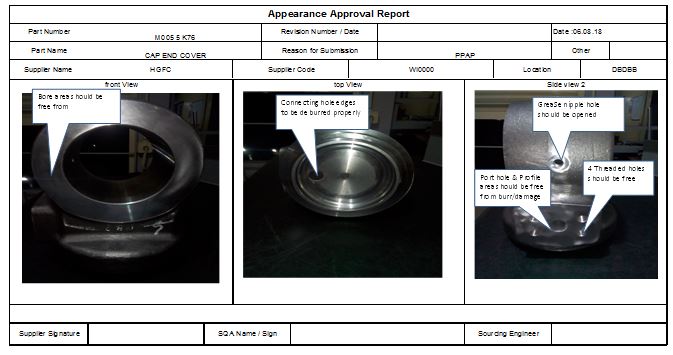
13.0) Appearance Approval Report
The Appearance Approval Inspection (AAI) is applicable for components affecting
appearance only. This report verifies that the customer has inspected the final product and
it meets all the required appearance specifications for the design.
The appearance requirements could include information regarding the color, textures, etc.
14.0) Checking Aids
15.0) Master Sample
A master sample is a final sample of the product that is inspected and signed off by the
customer. The master sample part is used to train operators and serves as a benchmark
for comparison to standard production parts if any part quality questions arise.
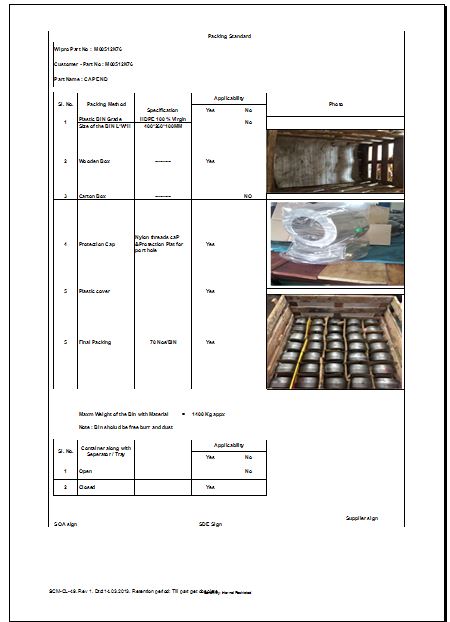
16.0) Packaging standards and specifications
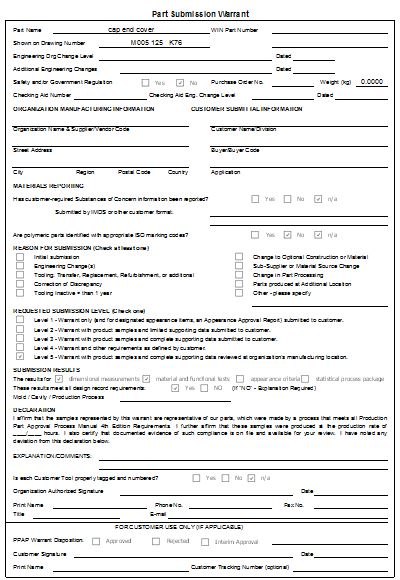
17.0) Part Submission Warrant (PSW)
This is the form that summarizes the whole PPAP package. This form shows the reason
for submission (design change, annual revalidation, etc.) and the level of documents
submitted to the customer. There is a section that asks for "results meeting all drawing
and specification requirements: yes/no" refers to the whole package. If there are any
deviations the supplier should note on the warrant or inform that PPAP cannot be submitted.
 |